In our endeavor to help companies improve their pricing capabilities we are often confronted with one key question from our clients: How do we know we are getting better? In some cases the answer to that question can be pretty straight forward: "let's look at the numbers". We would dive into the client's sales data to measure what is driving profitability and dissect how pricing along with other factors such as changes in volume, cost or mix are impacting business performance over time. We would also take a close look at metrics like price realization, cost to serve and pricing variability to determine positive or negative trends.
Although focusing on what your sales data is telling us is useful it does not really provide a thorough answer, especially when you consider the complexities of pricing. As we know, pricing is a multidisciplinary discipline that touches sales, product, marketing, operations, customer service and finance and of course, customers. Any of these stakeholders can have a direct impact on your company's pricing performance and in most cases companies don't have a good way to understand and measure impact.
To solve the pricing performance measurement challenge we set out to learn how companies measure performance across other disciplines. The goal was to learn from proven approaches in order to develop a transparent and effective way to help pricing executives measure pricing performance in a consistent, repeatable and on-going basis. In short, our goal was to help pricing executives objectively measure their impact.
Exploring measurement options and techniques
NPS® or Net Promoter Score® has become the de facto metric that almost every company uses to measure customer satisfaction, predict customer churn and in some cases assess overall performance. By asking respondents to rate a company, brand, or product on a scale of 0 to 10 in terms of how likely they would recommend it to friends, colleagues or relatives companies can get a sense of how they are performing. Perhaps because of its simplicity, NPS has become a well-established metric that many companies measure despite some of its limitations. For our purpose, however, we quickly realized that boiling pricing down to a single performance metric was not realistic due to its inherent complexity.
Another score used by companies to gauge performance focuses on reputation measurement. In 1997 a reputation management consulting firm began offering corporate clients strategies and insights into how they might gauge and improve their reputation among customers in various markets. Through a proprietary measurement system that tracks company perception in seven categories: products & services, innovation, workplace, governance, citizenship, leadership and performance, companies can diagnose the factors driving reputation performance. The goal was to allow organizations to answer the following questions: What is my reputation? How does it compare? and How can I improve it? Today, their reputation score is featured every year by Forbes magazine and has become the go to framework for measuring reputation performance for many of the most important companies in the planet.
We had the opportunity to talk to the company behind reputation measurement and we loved their intuitive, practical and time tested approach. This gave us the confidence that with a few modification we could create a very robust framework to help organizations measure pricing performance.
The Genesis of the Net Pricing Performance Score™
The process of creating and defining a robust and comprehensive way of measuring pricing performance has been fascinating. We started by compiling learnings from hundreds of pricing projects and validated our thinking through in-depth discussions with today's foremost pricing leaders to understand what factors they look at to gauge pricing performance. These efforts resulted in the creation of a unique rating model that combines customer, market and employee perceptions plus robust analysis of sales and market data.
Gathering the Data
Insights are collected through internal and external surveys and complemented with market and sales data. We then crunch the numbers in our proprietary AI platform to benchmark performance and develop a score. By understanding a company's ability to create value, compete in the market, sell on value along with data-driven measurements of price realization, discount variability, cost to serve, customer churn and margin performance we've are able to develop a holistic pricing performance score that truly captures the complexities involved in building a world class pricing organization.
The 8 Dimensions of The Net Pricing Performance Score™ (NPPS™)
Through a combination of perception measurement along with market and sales data we are able to put together a holistic picture of a company's pricing capabilities so you too can answer:
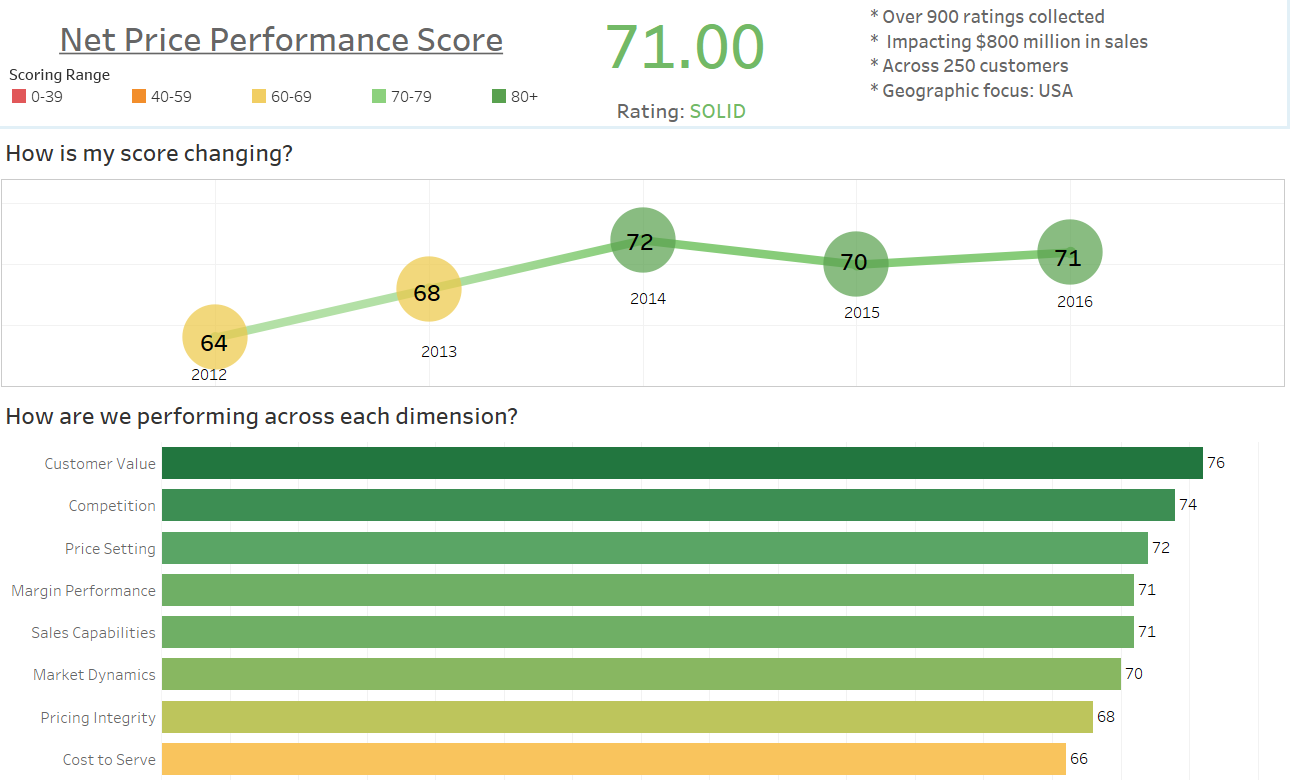
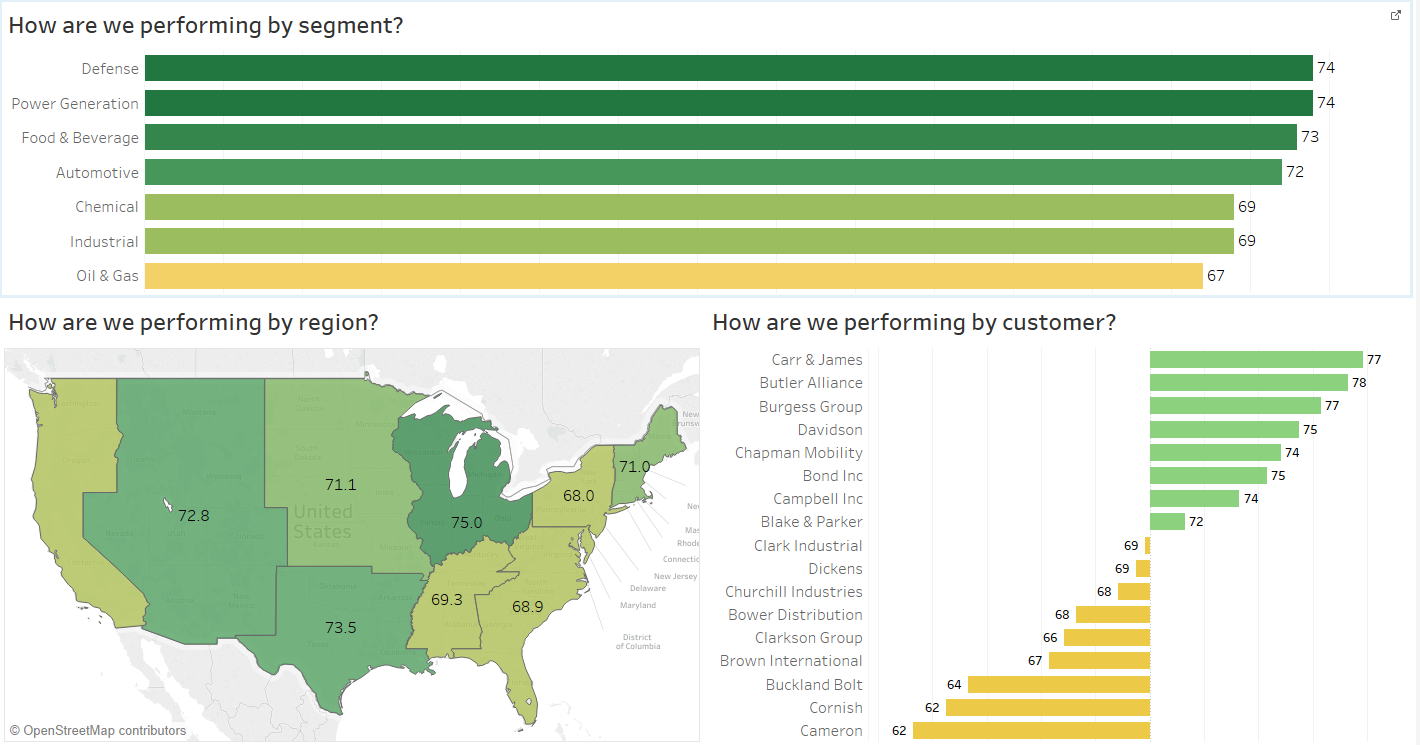
Below is an example of a powerful NPPS™ dashboard:
Although focusing on what your sales data is telling us is useful it does not really provide a thorough answer, especially when you consider the complexities of pricing. As we know, pricing is a multidisciplinary discipline that touches sales, product, marketing, operations, customer service and finance and of course, customers. Any of these stakeholders can have a direct impact on your company's pricing performance and in most cases companies don't have a good way to understand and measure impact.
To solve the pricing performance measurement challenge we set out to learn how companies measure performance across other disciplines. The goal was to learn from proven approaches in order to develop a transparent and effective way to help pricing executives measure pricing performance in a consistent, repeatable and on-going basis. In short, our goal was to help pricing executives objectively measure their impact.
Exploring measurement options and techniques
NPS® or Net Promoter Score® has become the de facto metric that almost every company uses to measure customer satisfaction, predict customer churn and in some cases assess overall performance. By asking respondents to rate a company, brand, or product on a scale of 0 to 10 in terms of how likely they would recommend it to friends, colleagues or relatives companies can get a sense of how they are performing. Perhaps because of its simplicity, NPS has become a well-established metric that many companies measure despite some of its limitations. For our purpose, however, we quickly realized that boiling pricing down to a single performance metric was not realistic due to its inherent complexity.
Another score used by companies to gauge performance focuses on reputation measurement. In 1997 a reputation management consulting firm began offering corporate clients strategies and insights into how they might gauge and improve their reputation among customers in various markets. Through a proprietary measurement system that tracks company perception in seven categories: products & services, innovation, workplace, governance, citizenship, leadership and performance, companies can diagnose the factors driving reputation performance. The goal was to allow organizations to answer the following questions: What is my reputation? How does it compare? and How can I improve it? Today, their reputation score is featured every year by Forbes magazine and has become the go to framework for measuring reputation performance for many of the most important companies in the planet.
We had the opportunity to talk to the company behind reputation measurement and we loved their intuitive, practical and time tested approach. This gave us the confidence that with a few modification we could create a very robust framework to help organizations measure pricing performance.
The Genesis of the Net Pricing Performance Score™
The process of creating and defining a robust and comprehensive way of measuring pricing performance has been fascinating. We started by compiling learnings from hundreds of pricing projects and validated our thinking through in-depth discussions with today's foremost pricing leaders to understand what factors they look at to gauge pricing performance. These efforts resulted in the creation of a unique rating model that combines customer, market and employee perceptions plus robust analysis of sales and market data.
Gathering the Data
Insights are collected through internal and external surveys and complemented with market and sales data. We then crunch the numbers in our proprietary AI platform to benchmark performance and develop a score. By understanding a company's ability to create value, compete in the market, sell on value along with data-driven measurements of price realization, discount variability, cost to serve, customer churn and margin performance we've are able to develop a holistic pricing performance score that truly captures the complexities involved in building a world class pricing organization.
The 8 Dimensions of The Net Pricing Performance Score™ (NPPS™)
- Customer Value: Measure customer perceptions of your ability to deliver value through your products and services
- Competition: Understand internal and external perceptions of how your offerings and innovation compare to the competition
- Sales Capabilities: Gauge internal and external perceptions of your organization’s ability to communicate value, negotiate prices and capture value.
- Price Setting: Evaluate your organization's ability to set prices on new products and services that are aligned with customer value
- Pricing Integrity: Evaluate price realization, discounting variability along with systems and processes used to manage prices
- Cost to Serve: Measure your organization's investments to serve customers & succeed in the market
- Market Dynamics: Assess customer behavior, market growth trends, customer churn patterns and market share performance.
- Margin Performance: Measure how changes in price, volume, cost and mix are impacting margins year over year
Through a combination of perception measurement along with market and sales data we are able to put together a holistic picture of a company's pricing capabilities so you too can answer:
- What is my pricing performance?
- How does it compare over time?
- How can I improve it?
Below is an example of a powerful NPPS™ dashboard: